Workspace
The Workspace is a research journal documenting experiments, systems, and ideas emerging from ongoing work across the labs. It provides a space for exploring studies, prototypes, and investigations in geometry, graphics, structured information, software design, and coding. It shows how ideas evolve, how experiments unfold, and how tools are gradually developed through continuous exploration and practice.
-
Inside the Workspace
Research notes, system architectures, software design, prototypes, and evolving tools.
-
See Ideas Evolve
Track how experiments unfold and tools develop through practice and investigation.
-
A Research Journal
Explore documented experiments, emerging systems, and studies across labs.
DIY Step 006: Learn DialogEditor from documentation
Following some of our Experiments, this step is about studying some automatic generated documentation.
DialogEditor
DialogEditor by Johan Rosengren at Abstrakt Mekanik AB is a lightweight tool for designing dialog interfaces
Supports creating and arranging UI elements like buttons, text fields, and layouts
Focused on quick prototyping with a simple, minimal interface
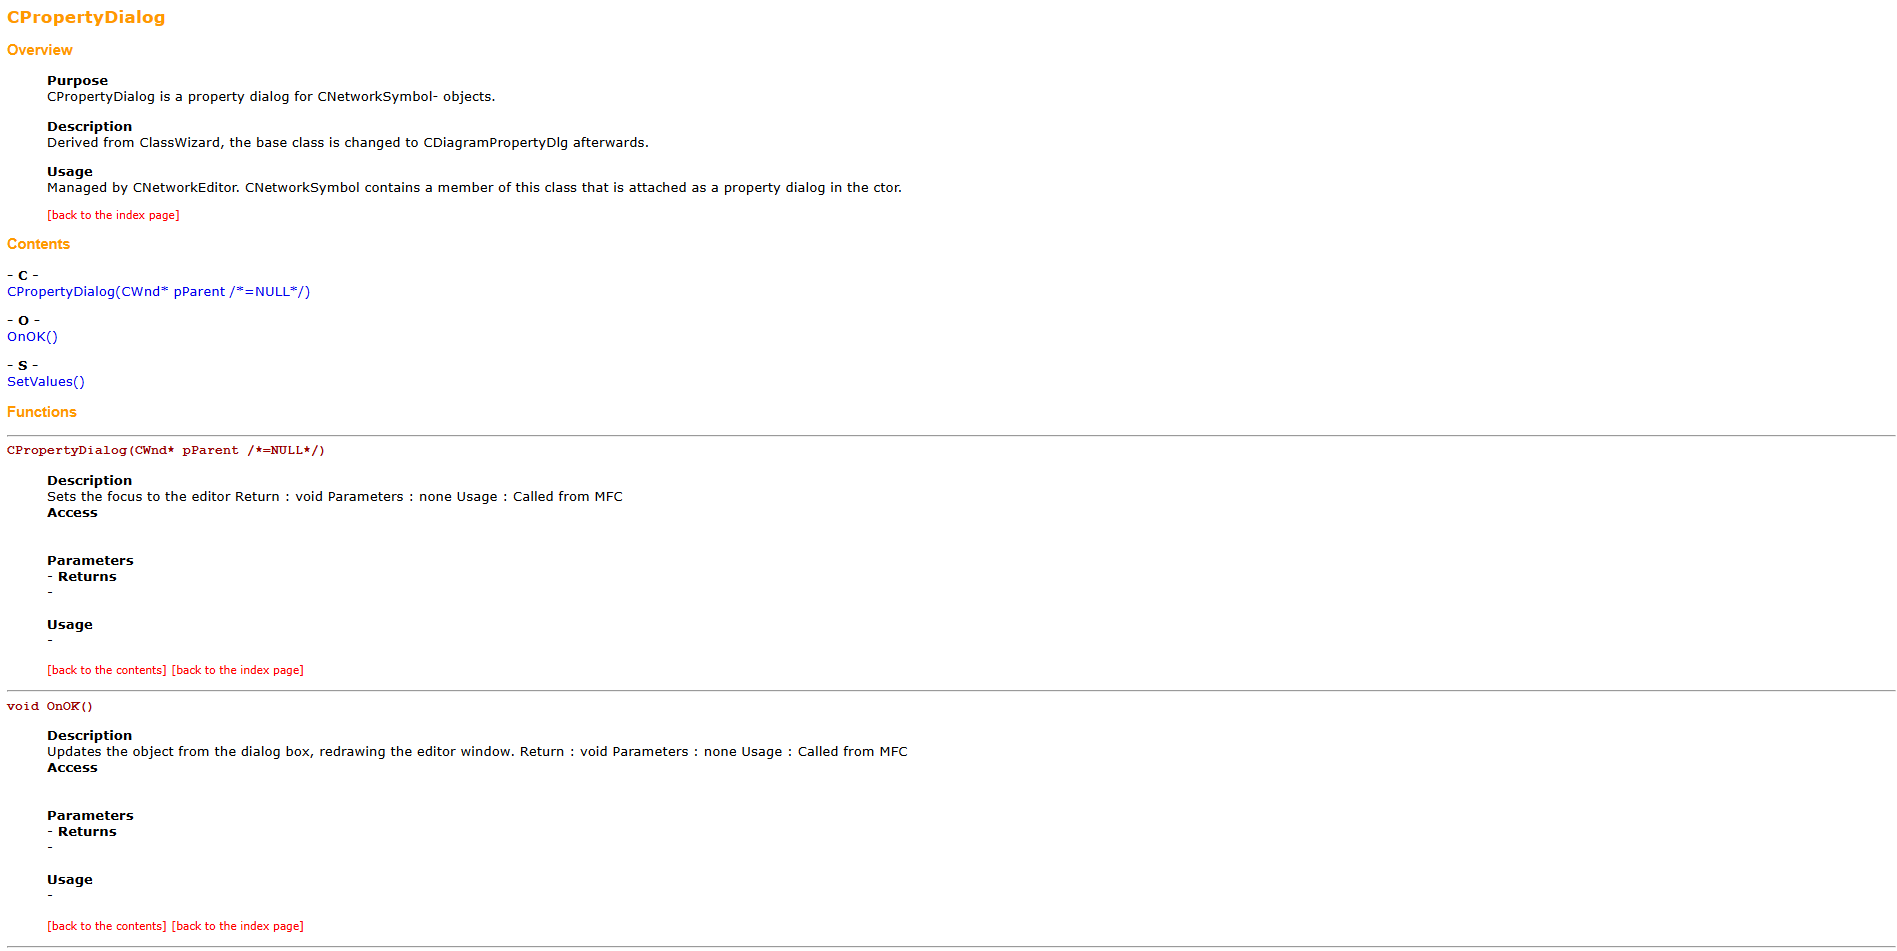
DIY Step 005: Learn NetworkMapEditor from documentation
Following some of our Experiments, this step is about studying some automatic generated documentation.
NetworkMapEditor
NetworkMapEditor by Johan Rosengren at Abstrakt Mekanik AB is a lightweight demo for creating network maps
Allows visualization of nodes and connections in a simple graphical way
Designed as a minimal example for experimenting with network structures
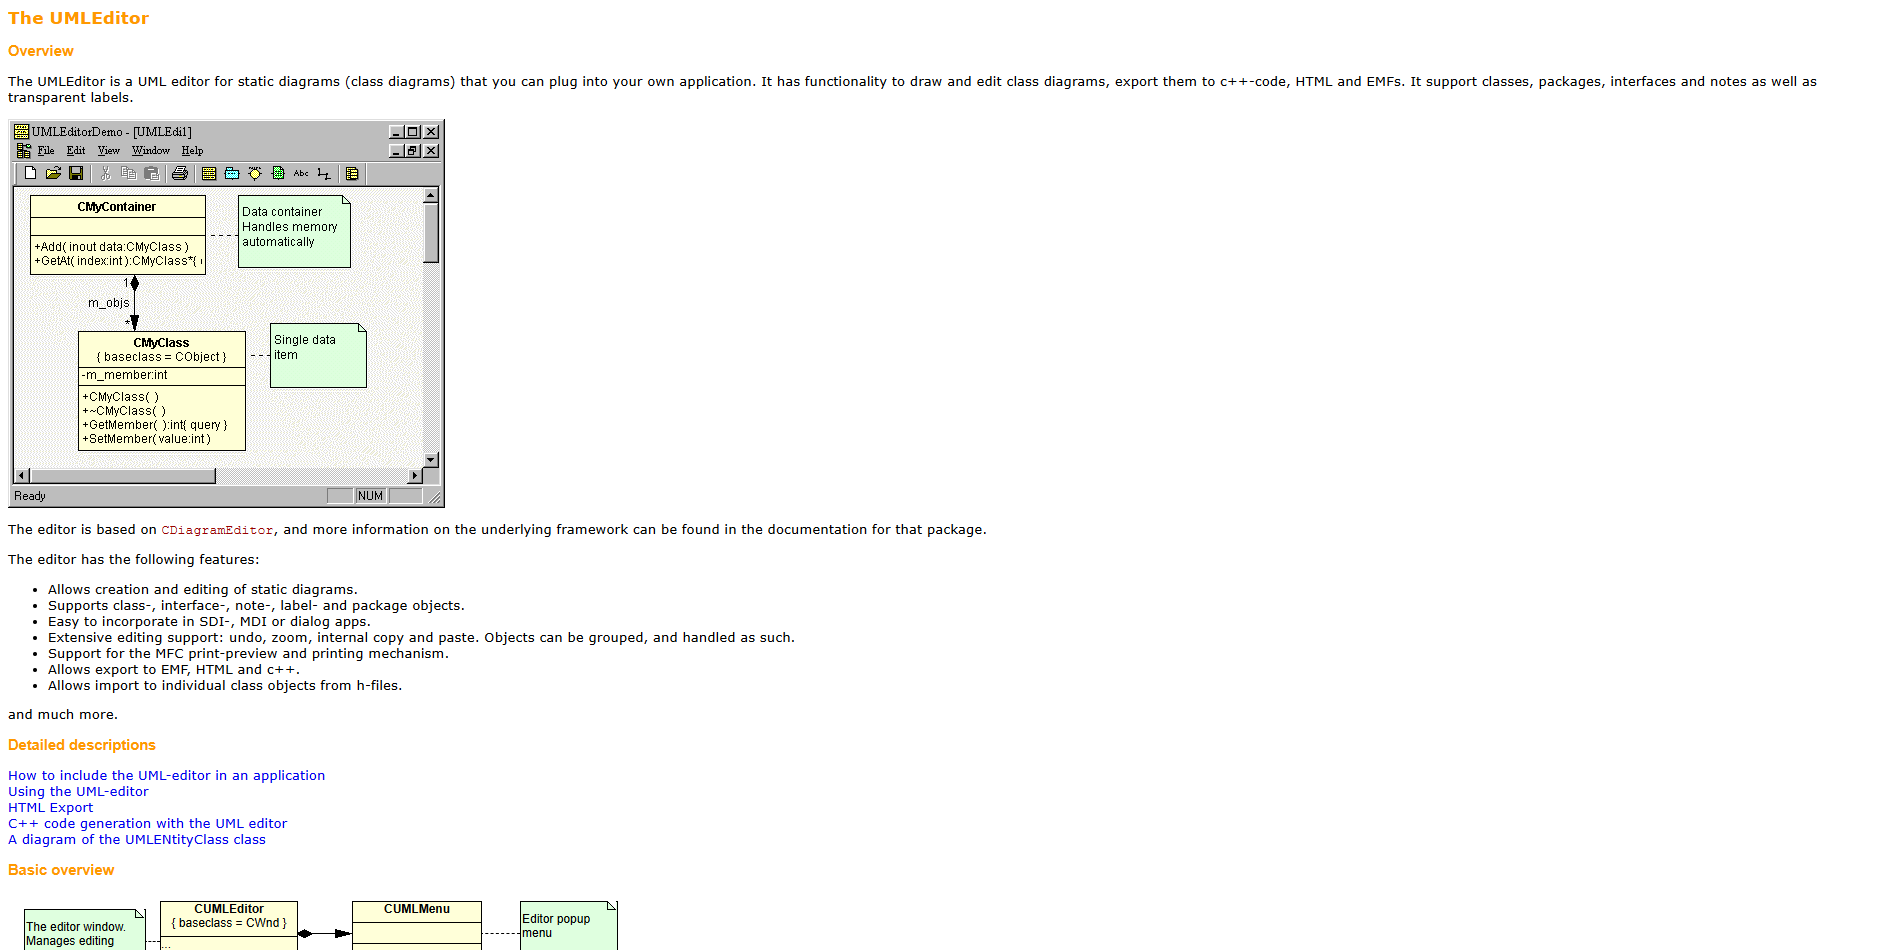
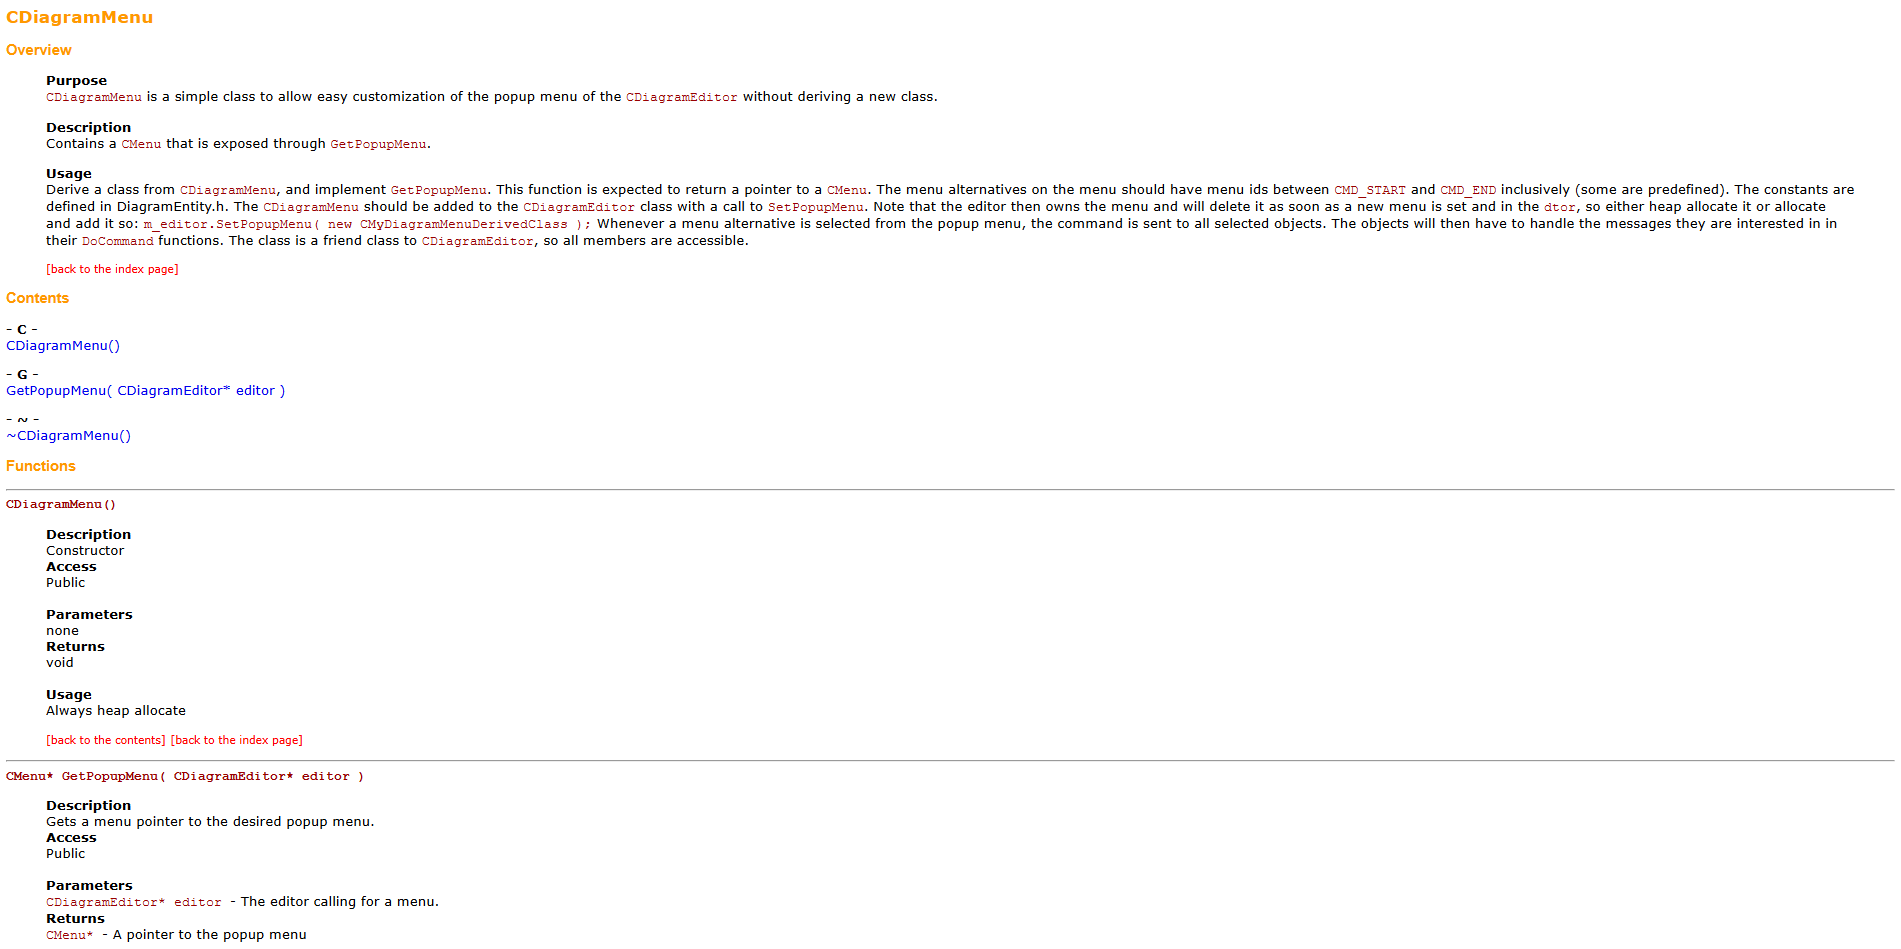
DIY Step 004: Learn UMLEditor from documentation
Following some of our Experiments, this step is about studying some automatic generated documentation.
UMLEditor
UMLEditor by Johan Rosengren at Abstrakt Mekanik AB is a lightweight tool for creating UML diagrams
Supports basic elements like classes, relationships, and connectors
Simple interface focused on quick, no-frills modeling
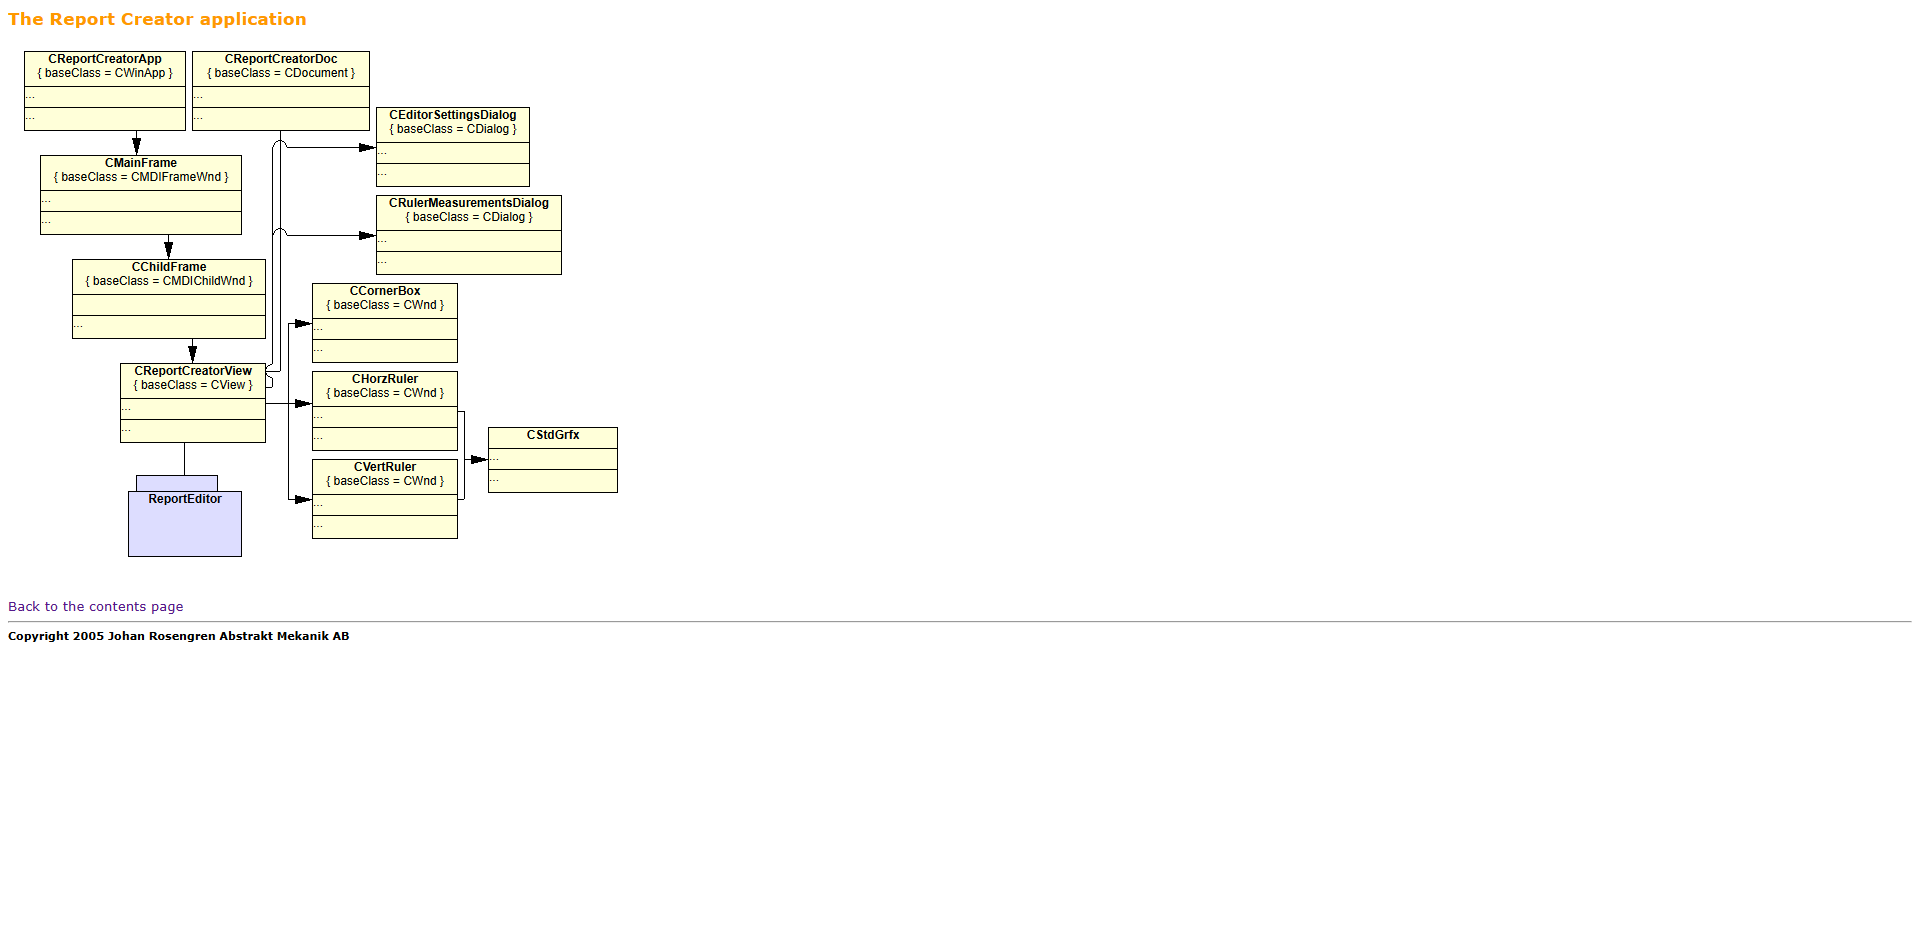
DIY Step 003: Learn ReportEditor from documentation
Following some of our Experiments, this step is about studying some automatic generated documentation.
ReportEditor
ReportEditor by Johan Rosengren at Abstrakt Mekanik AB is a lightweight text/report editing tool
Focuses on structured writing and simple formatting
Minimal interface, designed for quick document creation
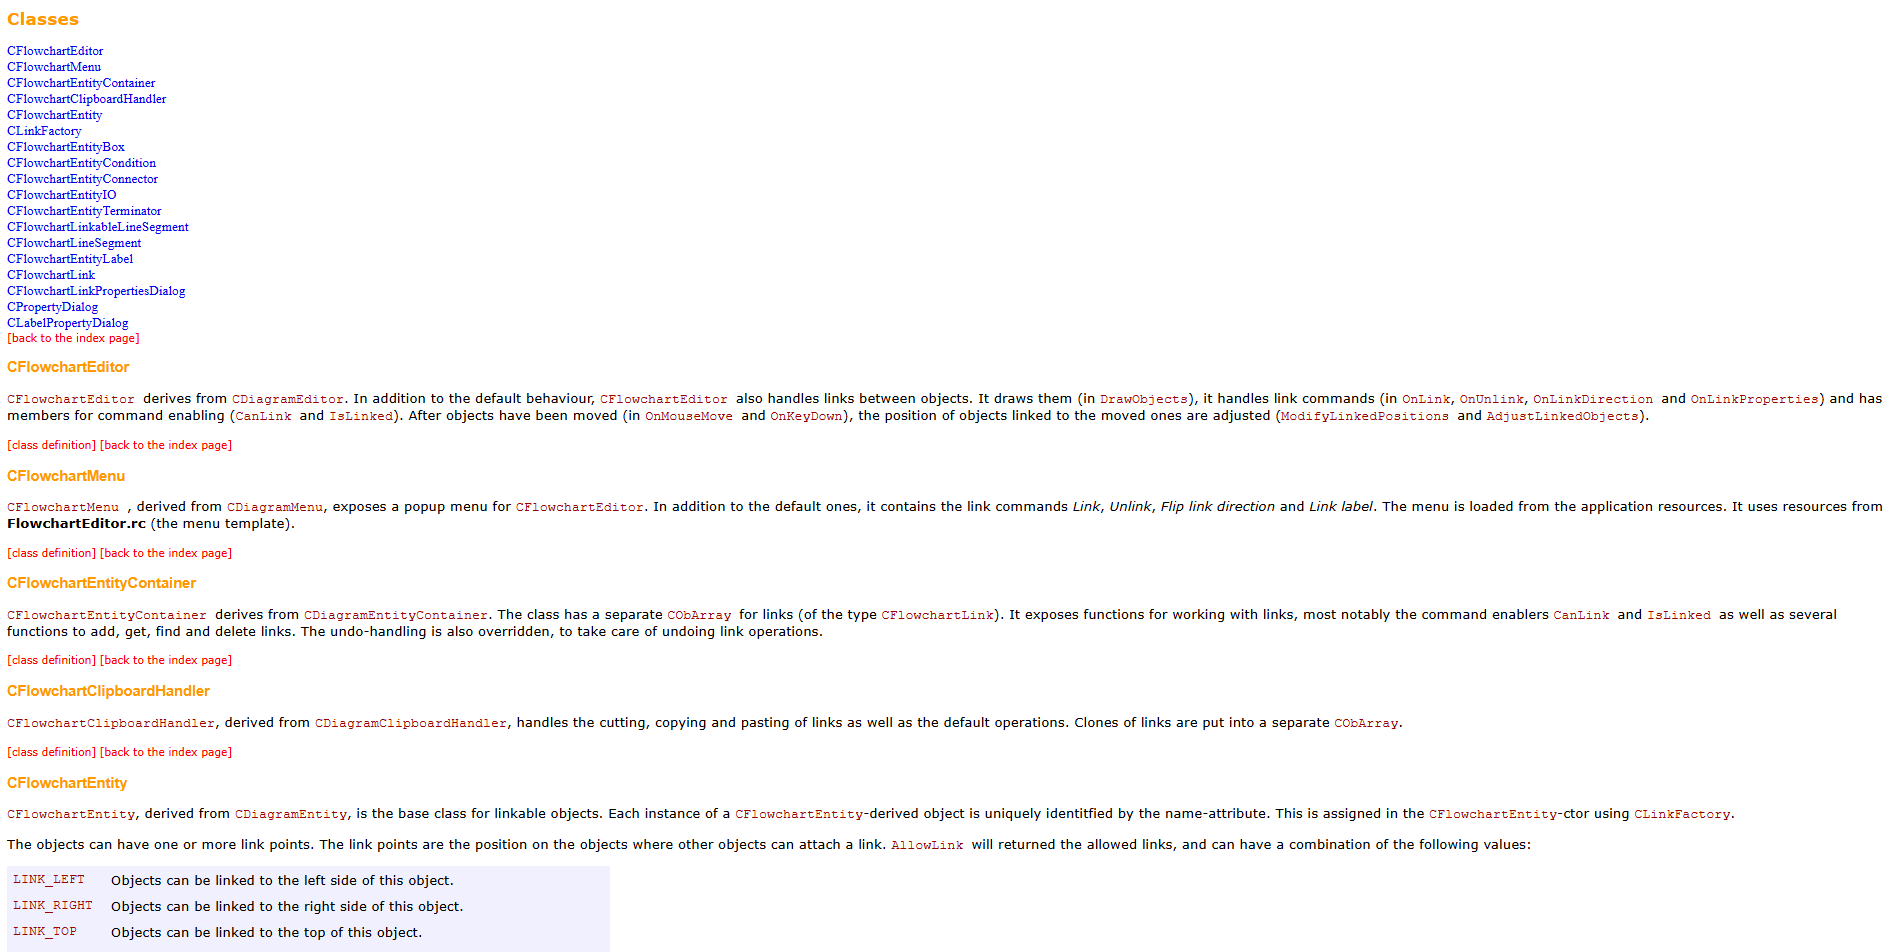
DIY Step 002: Learn FlowchartEditor from documentation
Following some of our Experiments, this step is about studying some automatic generated documentation.
FlowchartEditor
FlowchartEditor by Johan Rosengren at Abstrakt Mekanik AB is a lightweight Windows flowchart tool
It allows users create simple diagrams with nodes and arrows
Is designed for quick, minimal, no-frills workflow visualization
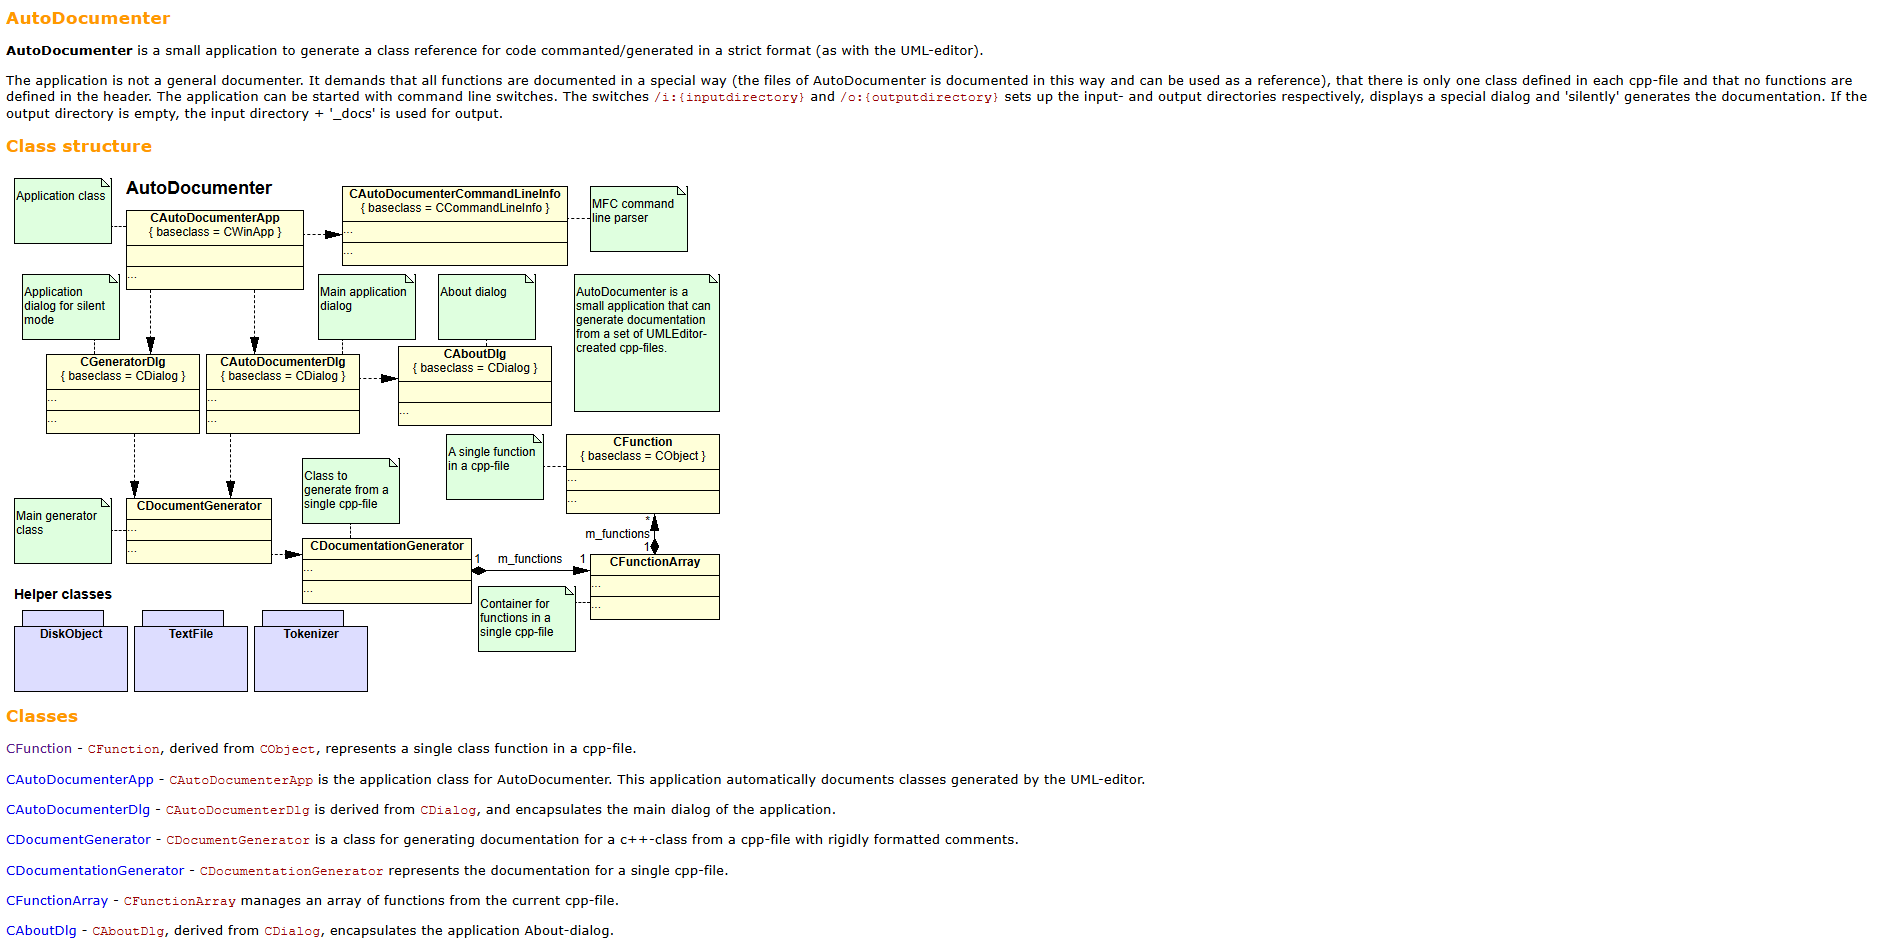
DIY Step 001: Learn about AutoDocumenter documentation
Following some of our Experiments, this step is about studying some automatic generated documentation.
Brace yourself!
We want to extract the best things from experiments
We want to show our approach to understand and present it to others
We want to adjust our work based on feedback from members
We want all members to be able to create themselves what we create
Introducing Applications and Services Section
Applications and Services are software programs designed to run on desktop or web platforms. They provide tools for productivity that make computers easier and more efficient to use in everyday tasks. They are important because they enable users and organizations to perform complex activities such as document creation, data analysis, and multimedia work.
Introducing User Experience Section
User Experience (UX) refers to how people feel and interact when using a digital product, website, or application. It focuses on usability, accessibility, and design that make tasks clear, efficient, and enjoyable for users. Good UX is important because it improves satisfaction, reduces errors, and helps users achieve goals quickly. It combines design, psychology, and technology to create intuitive and effective digital experiences.
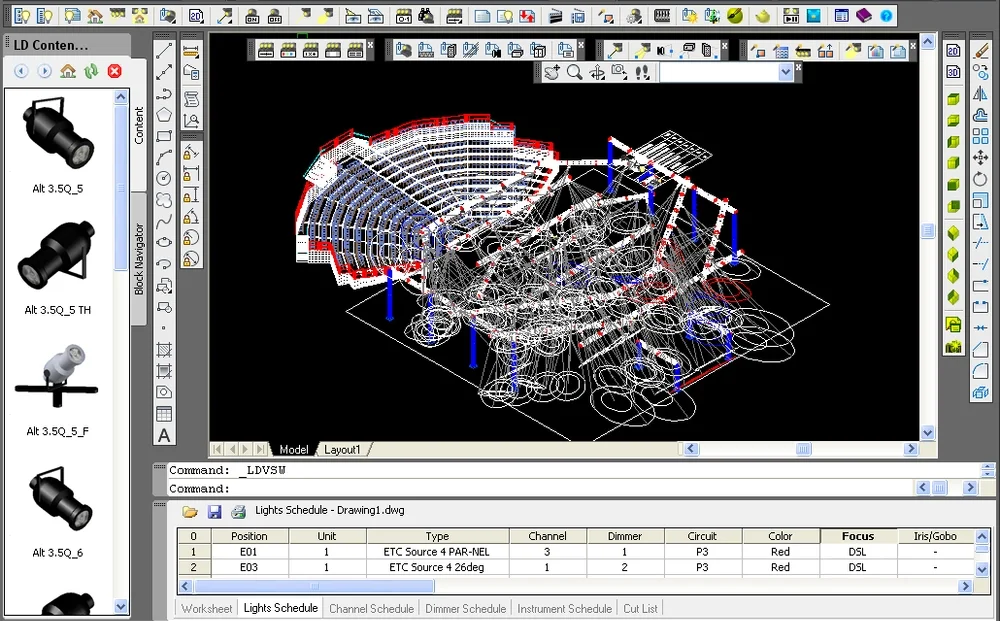
Introducing Commands and Editors Section
Commands and Editors are tools used within applications to let users create, modify, and control complex designs through precise tools and input commands. They are important because they enable accurate modeling, efficient editing, and detailed visualization in engineering, architecture, and digital graphics workflows.
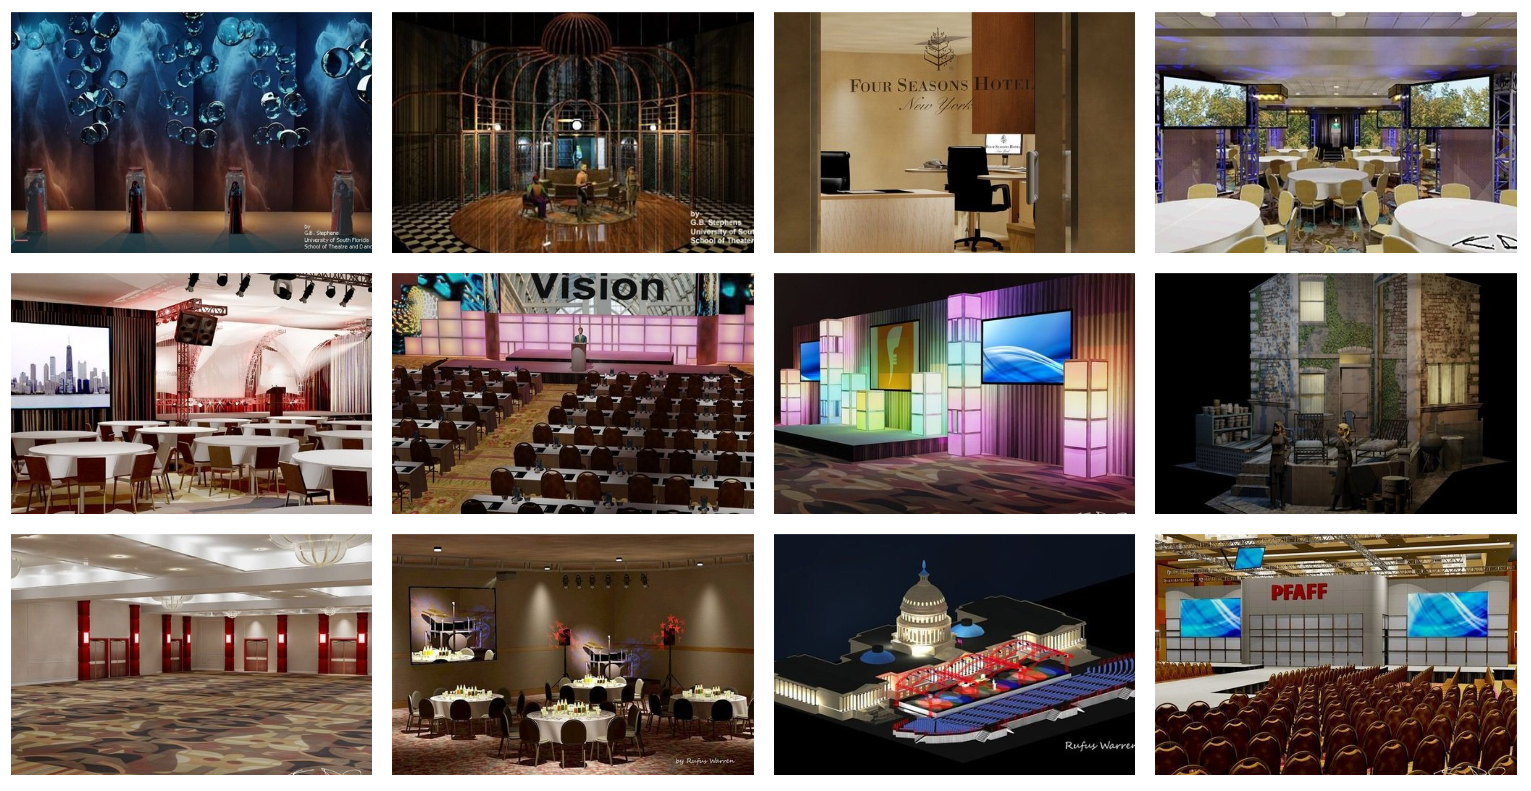
Introducing Views and Viewports Section
Views and Viewports in graphics applications allow users to look at a design from different angles or zoom levels within the same workspace. They are important because they help organize complex drawings, improve precision, and let designers analyze details and overall layouts efficiently during modeling or drafting.
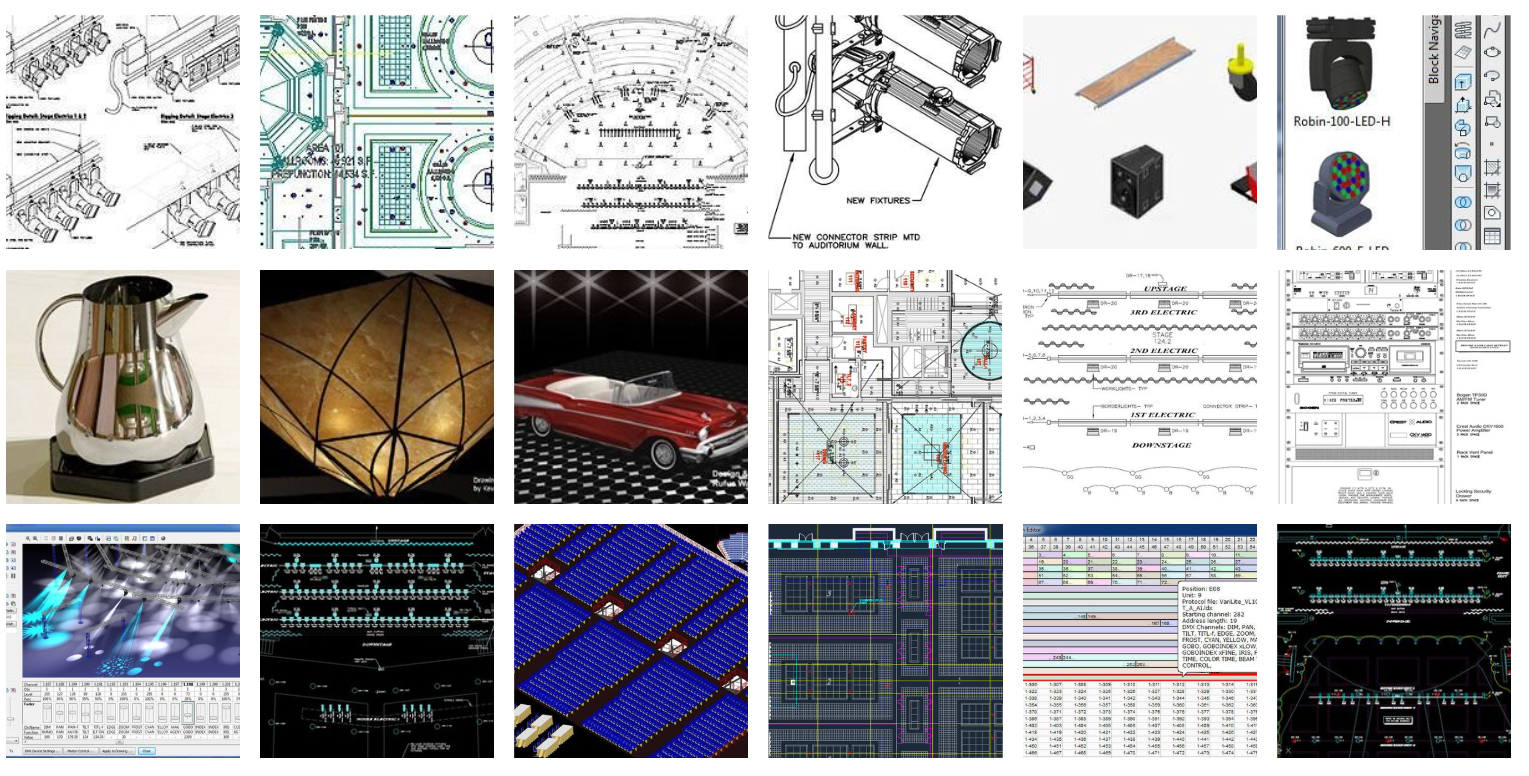
Introducing Geometry Systems Section
Geometry Systems in graphics applications define how shapes, lines, and surfaces are created and mathematically represented. They are important because they ensure accurate modeling, enable precise measurements, and support transformations such as scaling, rotation, and alignment in complex designs.
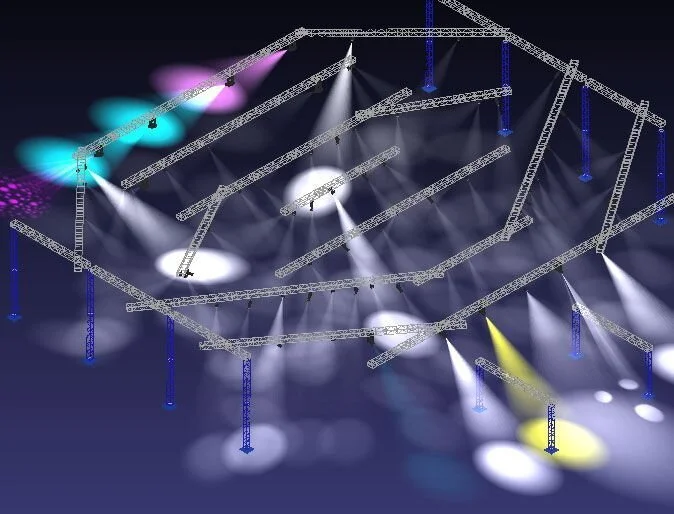
Introducing Graphics Systems Section
Graphics Systems in graphics-intensive applications manage how models, lines, and surfaces are displayed on the screen. They are important because they control rendering, colors, shading, and performance, allowing designers to visualize complex projects clearly and interact with them smoothly.
Introducing Data and Databases Section
Data and Databases in graphics-intensive applications store design information such as geometry, layers, materials, and project details. They are important because they organize and manage large amounts of design data, enabling efficient retrieval, collaboration, version control, and reliable project management in complex engineering and graphics workflows.
Introducing Documents and Formats Section
Documents and Formats in graphics applications define how design files are created, saved, and shared between users and systems. They are important because standardized formats preserve geometry, layers, and project data, ensuring compatibility, collaboration, and reliable exchange of complex designs across different tools and workflows.